|
Overshadowed by the Thanksgiving holiday, November sales of single family homes tend to begin quiet and then come to a slow crawl. The last part of that statement will be seen in December, but overall there certainly wasn't much movement. However, inventory keeps falling, with stable prices, which in itself is astonishing.
At least so far. 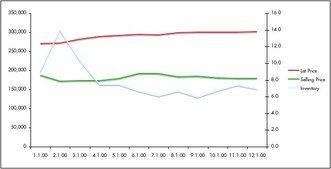 Table: single family home data per month’s end for Palm Beach, Broward and Miami-Dade (Florida) counties. Changes are month-over-month.
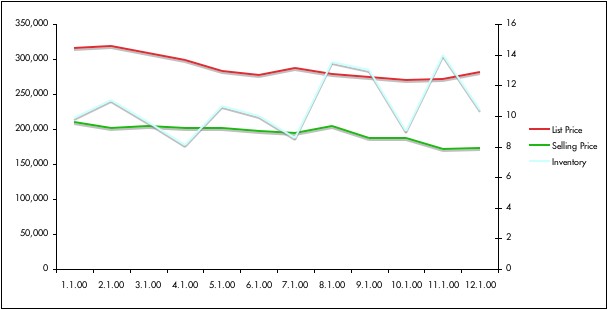
Chart: Single family home data Dec 2010 to Nov 2011. Red: median list price, green: median selling price, blue: inventory in months. – Data compiled from SEF-MLS
0 Comments
Matching the greyish economic mood in large parts of the country, October numbers for single family homes are a dull story. While the number of houses lingering on the market didn’t budge much, the number of closed sales dropped quite a bit month-over-month, 20 percent to be exact. That of course results in rising home inventory (though not in the modernist market!). Interesting is that despite the lack of movement, neither listing nor selling prices changed – stubborness or lack of maneuvering room, due to having reached the bottom already? As some media point to increased pending sales, remember my previous warning about that number: it means nothing. I see quite a few transactions going in and out of contract more than once, an abnormaly several years ago. So for now, I will disregard pending sales alltogether. The numbers for all Single Family Homes in the three counties:
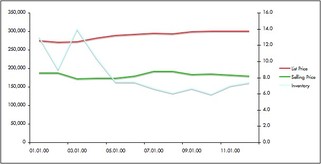 Table: all regional single family homes for sale/sold; data per last month’s end. Changes are month-over-month. – Chart: SFH data October 2010 to October 2011. Red: median list price, green: median selling price, blue: inventory in months. – Data source: SEF-MLS Because of overseas business travel, I did not have a chance to analyse the raw data and publish September statistics. My apologies.
At some point, if you read this column regularly, you must think I'm a grumpy old fart, uncontent and miserable. And here grumpy goes again: What is it with the press? Specifically, the housing numbers the press celebrated last and this week. Perhaps you think I live on another planet, or had too much beer at the Wiesn (aka Oktoberfest–and no, I didn't make it this year.) Perhaps the housing data and headlines released for August have a self-serving purpose. But they are definitely nothing to be jubilant about, though that's what some media are–again–screaming into our ears. THE SINGLE FAMILY HOME MARKET Despite a tiny bit of action in Palm Beach County, overall nothing really improved last month:
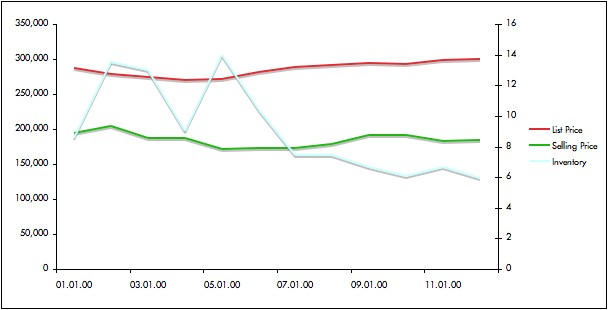 Table: all regional single family homes for sale/sold; data per last month’s end. Changes are month-over-month. – Chart: SFH data August 2010 to August 2011. Red: median list price, green: median selling price, blue: inventory in months. – Data source: SEF-MLS THE MODERN HOME MARKET As explained last month, I do not publish modern market data here anymore. Emphasis on here. I still compile market and sales statistics for modern architecture, including asking and selling prices, prices per square foot, time on market and price differentials. The complete data will continue to be available to my brokerage and consulting clients–just not publicly on this site. If you have an interest or need for modern market statistics, I welcome you to contact me anytime. And as always: thanks for reading this column! THE SINGLE FAMILY HOME MARKET After the party comes the after-party. Or the hang-over. And as so often, that’s the case here with July housing numbers. No wonder: June sales stats (for single family homes only; condos and townhomes are not subject of this column) were exceptional, while in July the general public experienced a congressional budget debate that was without precedence, tainted by obstructionism, vitriolic language and general nastiness. Consumers’ approval of Congress promptly dove way below 14 percent. Serves ‘em right. But if that wasn’t enough, while politicians were slinging mud or worse, unemployment in South-East Florida didn’t budge. That sapped the will to sign on the dotted line from a large contingent of home buyers, especially those who have to face lenders. Yes, those same lenders who would have given a mortgage to our Scottish Terriers a short while ago, and who now behave like a virgin facing a room full of gang-bangers. Who wants to buy a home under these conditions? Low rates alone don't cut it, friends. If only sellers had noticed. They sure didn’t in July: while all median list prices went up a notch, median list prices of homes that actually sold plummeted nearly 10 percent, median selling prices went down more than 4 percent, and the numbers of houses that sold just tanked. A wake up call? We’ll see. The July numbers:
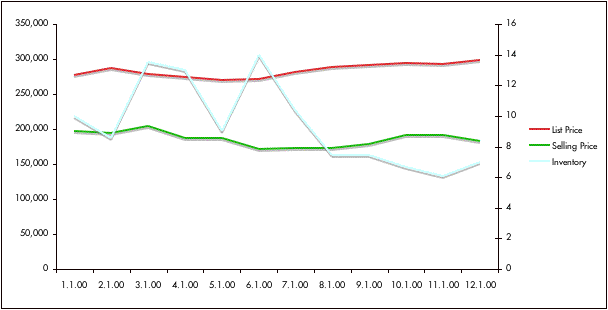 Table: all regional single family homes for sale/sold; data per last month’s end. Changes are month-over-month. – Chart: SFH data July 2010 to July 2011. Red: median list price, green: median selling price, blue: inventory in months. – Data source: SEF-MLS
THE MODERN HOME MARKET In case you are as modernist-crazed as I am, love stats and were looking forward to the newest market data for modern architecture: sorry, but no mas. At least not here. What happened? Simple: prospective consulting clients, a builder couple, approached me to assist them breaking into the South Florida market for modern homes. Part of the deal would have been my extensive modern-market statistics, going back at least six years. You know: past and present selling prices for modern architecture, which price ranges sell best, in which locations, in which towns, at what prices per square feet, with what type of amenities, etc. But for free. That didn’t work for me as you can imagine. I am surely not going to give proprietary and valuable data away, not on this website nor in any other form. I apologize to my three monthly regulars, but from now on, I will not publicize monthly modern market statistics anymore. The data is available to clients though, and if you are interested, please contact me. Sorry! THE SINGLE FAMILY HOME MARKET The market for single family homes in Southeast Florida (three counties Palm Beach, Broward and Miami-Dade) in June proved the old saying again “In the month of June, housing sales see a boon”. Ahem. Now you also know why some persons were not admitted into Rapping 101. Seriously: as in the last four years, June is the month so far with the highest number of SFH closings in all three counties (in 2009 it tied with December). Those June closings would have been signed into contract in April or May. Does that mean buyers want to buy before school’s out? Before it gets too hot? Before Memorial Day? This Realtor is at a loss to explain. Some people may argue that winter should be the peak real estate season, when the Florida population swells and there are more potential buyers around, especially from colder climates. But not so, at least not for single family homes. Another oddity: while inventory keeps tightening, prices still slide – not every month, but certainly year over year; minus 5.0 percent in this case. Go figure. The June numbers:
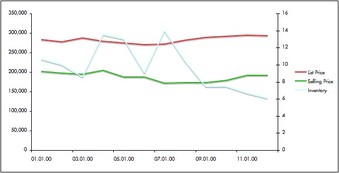 Table: all single family homes per SEF-MLS; data per month’s end. Percent changes are month-over-month. – Chart: SFH data June 2010 to June 2011. Red: median list price, green: median selling price, blue: that's the dwindling inventory, in months. – Data source: SEF-MLS
THE MODERN HOME MARKET Despite what it looks like – a modernist inventory spike in June – there really isn’t one. Easy to say. But it doesn’t feel like an upswing in inventory; quite in contrast. As explained last month, the number of available homes under $1M shrank by 25% year over year, the number offered under $500K went down by a hefty 45%. The little inventory uptick in June (per June 30th to 255 modern homes) has already been erased – as of writing this post, it is down again. And so are absolute listing and selling prices. (Data table and graph temporarily not available – sorry) Thinking about selling your modern home and need an inside perspective of the modernist market? Out to buy, and need a Realtor who gets modernism? Then please call me at 954.834.3088 or email me anytime – and until next month! THE SINGLE FAMILY HOME MARKET Yes, there are still plenty of condominiums for sale. Yes, there are still many foreclosures, and a shadow inventory (properties not official on the market) of unknown proportions. But for now, cherry-picking time is over. At least thats what my observations during everyday searches for clients say and what statistics confirm. The market for single family houses in Southeast Florida has turned:
It seems I was too skeptical when I wrote in May I am not quite sure where some of the exuberant reported data on our regional market in April come from. The market for all single family houses in May: * Houses for sale: 22,025 (0.2%) * Inventory: 6.7 months (10%) * Median list price: $294,300 (+1.0%) * Median list price per sf: $142 (no change) * Houses sold last month: 3,308 (+5.8%) * Median selling price: $ 191,333 (+7.2%) * Median selling price per sf: 102 (+3.0%) 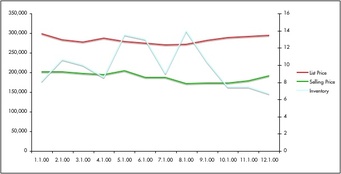 Table: all single family homes per SEF-MLS; data per month’s end. Percent changes are month-over-month. – Chart: SFH data May 2010 to May 2011. Red: median list price, green: median selling price, blue: that's the dwindling inventory, in months. – Data source: SEF-MLS THE MODERN HOME MARKET As always - read: since I write this blog - the modern market precedes the movement of the overall market. That can be interpreted good or bad currently bad for buyers, as there are less and less modernist homes to choose from. Inventory is dwindling monthly if not weekly, in May dropping the sixth month in a row. Not a nice record to write about if your expertise and speciality is promoting and brokering modern architecture. Compared to one year ago, in the most active price range under $500,000 there are 45% (!) fewer modern houses for sale. Translation: tough times for buyers, who will have to be patient to find the right property and ready to react – viewing it, finances lined up, and writing an offer – as soon as it becomes available. Owners and sellers of modern homes: please contact me so we can meet for a cup of tea and a chat. Please! In summary: against all intuition (and the arguments of some of my clients, savvy investors in their own right), June has been the month with the highest number of closings in South Florida – at least during the last four years. I’ll let you know as soon as possible if this holds true for 2011 as well. --- In the meantime, thank you for reading this blog, let me know if you have any questions - and stay cool! Several real estate markets are starting to show signs of improvement with home prices in the last quarter as the industry demonstrates more signs of stabilizing, according to Clear Capital's latest monthly Home Data Index Market Report.
REO saturation rates have improved in the majority of the country’s largest markets. However, many areas are still battling year-over-year price declines. Clear Capital’s index reports that quarter-over-quarter home price declines were 2.3 percent in the latest quarter, which is less than half compared to the previous month. “The latest market report results through May suggest that home prices are starting to ease back from the heavy declines seen over the winter,” says Alex Villacorta, director of research and analytics at Clear Capital. “We are still far away from the strong demand needed to fully turn things around for the housing market. However, it is clear from the initial spring sales data that prices are softening, suggesting stabilization in the market." The High Performers Seven of the top 15 markets posted quarter-over-quarter property price gains in this month's report, compared to none in last month’s, according to Clear Capital. Here are the seven highest-performing major real estate markets, according to the report. 1. Washington, D.C.-Arlington, Va.-Alexandria, Va. Quarter-to-quarter home price change: 4.5% Year-to-year price changes (May 2010-May 2011): 4.9% REO saturation: 17.5% 2. St. Louis, Mo. Quarter-to-quarter home price change: 2.2% Year-to-year price changes: -11.4% REO saturation: 35.3% 3. Pittsburgh, Pa. Quarter-to-quarter home price change: 1.6% Year-to-year price changes: 0.3% REO saturation: 10.9% 4. New York, N.Y.-Long Island, N.Y.-No. New Jersey, N.J. Quarter-to-quarter home price change: 1.5% Year-to-year price changes: 1.4% REO saturation: 9.6% 5. Virginia Beach, Va.-Norfolk, Va.-Newport News, Va. Quarter-to-quarter home price change: 1.4% Year-to-year price changes: -13.2% REO saturation: 22.4% 6. Miami-Fort Lauderdale-Miami Beach, Fla. Quarter-to-quarter home price change: 0.6% Year-to-year price changes: -5.2% REO saturation: 39.6% 7. San Jose-Sunnyvale-Santa Clara, Calif. Quarter-to-quarter home price change: 0.5% Year-to-year price changes: -5% REO saturation: 25% Tthe lowest-performing market for the fifth straight month was Detroit-Warren-Livonia, Mich., with a 13.2 percent decrease in quarter-over-quarter home price change and a 58 percent REO saturation rate. Source: “Clear Capital Reports Quarterly Home Price Decline Slows; Signs of Market Stability as Summer Approaches,” Clear Capital (June 9, 2011) via Realtor.mag THE HOUSE MARKET OVERALL The MLS data for April for Southeast Florida show a slight increase in selling prices for single family homes in Palm Beach and Miami-Dade county, while Broward county remained stable in volume and prices. Inventory is steady at seven months, very close to the normal range for a balanced market. But the data raise two questions: with a plethora of short sales and foreclosures available (the latter often not on the MLS), it makes me wonder how small then must the non-distressed inventory be? And secondly, as everyone has access to the same data set from the MLS, I am not quite sure where some of the exuberant reported data on our regional market in April comes from. Perhaps condos and townhomes? There certainly is activity and even selling price increases (6% m-o-m in Dade, 5% in Palm Beach), but it’s not exactly a firework either. The overall single family house market in Southeast-Florida in April: * Houses for sale: 23,241 (–0.2%) * Inventory: 7 months (no change) * Median list price: $291,333 (+0.8%) * Median list price per sf: $142 (no change) * Houses sold last month: 3126 (–4.6%) * Median selling price: $178,450 (+3.3%) * Median selling price per sf: $99 (+3.5%) 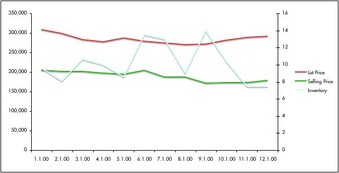 Table: all single family homes per SEF-MLS; data per month’s end. Percent changes are month-over-month. – Chart: SFH data Apr 2010 to Apr 2011. Red: median list price, green: median selling price, blue: inventory in months. – Data source: SEF-MLS
THE MODERN HOME MARKET A much much tighter spot is the modern home market. That inventory is shrinking weekly – not even monthly – all the while demand for modern architecture is increasing, to a point where I am running out of modern houses in certain price categories. My database of modern architecture for sale – and I know of and catalogue practically everything that is available – is down to 236 properties in all three counties. This is the lowest it’s ever been since five or six years. In the first three weeks of May alone, there was an inventory drop of 12.7%. In addition, when a home’s value equation fits a buyer’s expectation, sellers can realise price increases, as the April data show. So for modernist buyers, it is rather important to be prepared and to be able to react quickly when the right home comes along. Waiting for falling prices and an increasing selection will leave the stragglers on the street, and judging from the inquiries I receive, this situation will get worse as schools start again in August. --- As always, I invite your comments and questions. And thank you for reading this blog! THE HOUSE MARKET OVERALL “In like a lion and out like a lamb”: one of the common sayings about March weather. If your observations confirmed it this March, chalk one up for the proverb. But if March did something else, don’t totally reject the proverb – it might turn out to be true next year. And just like the weather, so is the housing market: variable, full of surprises, and it might even be changing. – Who would have guessed? “In like Lion” is true so far - February sales data were baffling because they were so strong, and March continued that trend. Looking at the three counties, Palm Beach had a slight increase (+3%) in list prices and a 44% increase in sold homes, albeit with an 8% decrease in selling prices. But: the disconnect between seller’s wishful thinking and buyer’s acceptance rose by 19 points to 189, the highest number since this number was recorded (2006). Broward County was a bit more civil, with list prices up a fraction, a decreased disconnect, sales increasing by 23% and selling prices increasing by 3%. Buyers perhaps rewarded less greed? Finally, Miami-Dade county fared even better with an 8% increase in selling prices combined with a 22% increase in sales. The numbers: * Houses for sale: 24,345 * Inventory: 7 months (-28.6%) * Median list price: $288,950 (+2.7%) * Median list price per sf: $141 * Houses sold last month: 3276 (+32.9%) * Median selling price: $172,667 (no change) * Median selling price per sf: $95 (no change) (Percent changes are month-over-month) 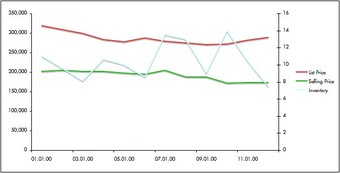 (SFH data Feb 2010 to Feb 2011. Red: median list price, green: median selling price, blue: inventory in months. Data source: SEF-MLS)
THE MODERN HOME MARKET It is time for the regular disclaimer/explanation how the modern-stats on this page are collected: Data for all sold houses are reliable and for an MLS-participant (means for a Realtor®) easily accessible from the SEF-MLS. In contrast, sales data for modern houses are much more difficult to come by, because the MLS does not allow filtering for modern architecture. Therefore, all statistics for modern architecture rely on observed data, and those observations, coming from no less than seven MLS-searches, are very time-intensive and occasionally more art than science. --- As always, Tobias invites your comments and questions. And thank you for reading this page. Headed for destruction unless quickly purchased, you can buy one of these livable works of art and keep it from doom. Alert 1: Are you the ultimate tinkerer? Good with tools? Want a house for $14,000? The Collins Street Lustron in Nashville NC, less than an hour from Raleigh, is owned by the church next door which needs a new parking lot. This classic 1950’s prefab house will be carted off to the dump within two weeks unless you act now. The demolition contractor hired recently by the church, Lane Johnson, has become a big Lustron fan and has offered a short “stay of execution.” Lane will painstakingly disassemble the modular Lustron (like an erector set) and put it on a truck for $14,000. That’s an entire house, delivered to you, for the cost of a car. He’ll even get you the assembly manual. Bring this bad boy to your backyard! For more information, contact Tobias please.  Above: home by Lustron, $14,000. Below: home by Voorhees, $269,000  Alert 2: It takes a special kind of person to design and build their own home from scratch, and [Raleigh] city planner John Voorhees did just that in 1961. 2727 North Mayview is wildly central inside Raleigh, just off Brooks Avenue. You could not get a better location. The owners have put the property on the market as a lot, which means certain death for this unique Modernist home. I spoke with the listing agent, and no doubt about it, the house needs some work but can be saved by the right person. $269,900. For more information, contact Tobias please. Alert 3: As reported earlier, News 14 Carolina picked up our national preservation alert for A.G. Odell’s Lassiter House in Charlotte, NC.  Steel beams support the roof and eliminate the need for load-bearing interior walls, thereby enabling large open spaces to predominate throughout the interior.
A particularly ingenious scheme was an arrangement whereby the dining table could be set in the kitchen, complete with food and adornments, and slid through the wall into the dining room. Appeared in Better Homes and Gardens September 1956. Charles McMurray did an addition in the 1970's. Included a saltwater pool at one point. In need of major renovations. Unless sold, this unique modernist house will be demolished in June. 3 BR, 2.5 baths, $785,000. Watch the video, and contact Tobias for more information please. ____ Via Triangle Modernist Houses THE RESIDENTIAL MARKET OVERALL The February market for houses in the Southeast Florida Tri-County area, encompassing Miami-Dade, Broward and Palm Beach, suddenly turned extremely active. Fewer homes came on the market, and while the numbers show a very slight increase in median list prices, the number of sold homes is up drastically, with largely unchanged but rather soft selling prices. Interesting also: the very volatile inventory curve over the last six months. Pent up demand or investors? The reasons for the sudden activity are not quite clear to me or many of my colleagues. One bird doesn't make spring though; it remains to be seen how this will develop over summer. Certainly Florida unemployment hasn't changed much, which is the biggest factor in property purchase decisions. The numbers:
 (SFH data Feb 2010 to Feb 2011. Red: median list price, green: median selling price, blue: inventory in months. Data source: SEF-MLS) THE MODERN HOME MARKET In the meantime, in the modern market available inventory as well as prices of observed sales are further sinking, while prices per sf went up last month. The lower end of the market – approx. under $1.5m, really bad under $800k – still looks plundered like a supermarket shelf just before a storm. Good homes generate a lot of interest from multiple buyers and go under contract fast, so it's not the time to lean back and relax if an interesting home does become available. ___ As always, your comments and questions are welcome! If you wonder where the January market data went: for lack of sufficient data I could not publish them so far.
As I am in the process of collecting February data, I will include January statistics if the data set for that month is large enough. Expect the data for February to be published here around mid-March – and thank you for your interest. WELCOME to all new readers and to all regulars from my ModernSouthFlorida-blog. I moved the blog over to this site since keeping the two sites – blog and website – under one roof makes much more sense then in two different houses. A bit like two teenagers: easier to keep them in line and on track. As soon as there is a blog-import feature by this site's host (spring 2011), all previous bog-posts will be moved over here. Until then, you can read them here. So off we go, with the riveting December market statistics for homes in the Southeast Florida market: THE OVERALL HOUSE MARKET Single family home numbers for December are rather tame (or lame), after a little bit of a firework in early and mid-summer last year. Highest median selling prices in 2010 were recorded in March at $210,233. That is 11 percent above year's close, which itself was nearly the same as the median January selling price. Median asking prices last year dropped by 15 percent, and the end may not be here yet. Inventory fluctuated between 9 and 14 months, ending in December at 9 months with 26,826 homes for sale, but a strong absorption of 2,977 houses. 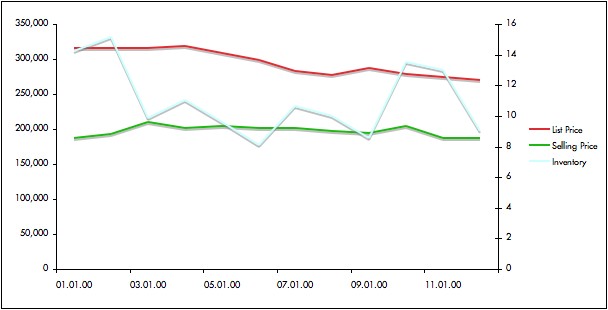 (SFH data Jan 2010 to Dec 2010. Red: median list price, green: median selling price, blue: inventory in months. Data source: SEF-MLS) THE MODERN HOMES MARKET An interesting development continues in the market* for modern homes - it moves around like a pesky mosquito:
Questions, comments? I'd love to hear from you!
_____________________________________________________ (*Please remember that these data are for observed sales only, but still, they continue a trend observed for several months now). THE RESIDENTIAL MARKET OVERALL
The November single family home market wasn’t exactly fun. The wee bit of activity that was came at the price of, um, the prices: median list prices fell a timid 1.2 percent, but median selling prices dropped a hefty 8.3 percent. But that still did not buoy the market. So who’s asleep at the wheel: sellers on 500mg Xanax, wishfully thinking their house is so much better than anyone else’s? Or real estate agents, desperately chasing any listing they can get, as overpriced as it may be? Probably both. Case in point: a house in my neighbourhood, fresh on the market and according to a quick analysis approx. 25 percent (!) overpriced. That’s either major brawn or what’s called “shooting with wet powder”. Good luck. – The November numbers: * Inventory for sale: 27,538 (13 months supply) * Median list price: $274,667 * Median list price per sf: $138 * Units sold last month: 2,136 (3.7%) * Median selling price: $186,667 (-8.3%) * Median selling price per sf: $105 (SFH data Nov 2009 to Nov 2010. Red: median list price, green: median selling price, blue: inventory in months. Data source: SEF-MLS) THE MODERN MARKET The modern market in November went against trend, as this segment so often does: compare the selling price uptick in modern homes vs. selling prices of all homes (green curve). That doesn’t mean stellar performance and ecstatic sellers, but despite inventory going up and absorption rate down, median selling prices as well as selling price per sf managed a 15+ percent increase over the previous month. Unchanged is the market segmentation: few good properties under ca. $1.3m - $1.5m, really difficult under $600,000, and plenty to choose from above ca. $1.5m to $2m. I do not foresee this situation changing any time soon. And with mortgage rates possibly rising – despite stubborn unemployment, a key factor in housing activity – more buyers may become active in the market. ___ Have a nice weekend! All ModernSouthFlorida-blog posts until November 2010 can be read under http://ModernSouthFlorida.blogspot.com.
As soon as my host offers an import tool (spring 2011?), all archived posts will be available on this site as well. |
 AuthorTobias Kaiser works as an independent real estate broker and consultant in Florida since 1990. Always putting his clients' interest first, he specialises in modern Florida homes and architecture, as well as net leased investments. Archives
April 2024
|
- Home
- Modern Homes for sale
- Selling a Home
- Inquiries
- Why Tobias Kaiser?
- Contact
- "Modernist Angle" Blog
- Services we offer
- South Florida City Profiles
- Intro to Modernism
- Modern Styles explained
- Elements of Modern Architecture
- Preservation
- Real Estate FAQ
- Deutsche Seite >
- Net-Leased Investments >
- About Tobias Kaiser
 RSS Feed
|
|
KAISER ASSOC, INC • LIC FLORIDA REAL ESTATE BROKERS & CONSULTANTS
dba MODERN FLORIDA HOMES • 370 CAMINO GARDENS BLVD • BOCA RATON, FLORIDA 33432, USA TOBIAS KAISER, MSc, CIPS • REALTOR/BROKER • MODERN ARCHITECTURE SPECIALIST MEMBER NAR, RCA, DOCOMOMO, NCMH • EMAIL • (+1) 954 834 3088 ZERO DISCRIMINATION: Kaiser Assoc. and its agents will not discriminate against any person because of race, color, religion, sex, handicap, familial status or national origin in the sale or rental of housing or lots, in advertising the same, in the financing of housing in the provision of real estate brokerage services, in the appraisal of housing, or engage in blockbusting. Kaiser Assoc. strictly adheres to the National Association of Realtors© Code of Ethics and Standards of Practice in accordance with Federal Fair Housing Laws. "SILENCE IS CONSENT": As a multi-cultural office neither do we silently consent to nor do we tolerate any type of discrimination, racism or prejudice. We strive to listen and learn what needs to be done to implement permanent change. Site design + contents ©Tobias Kaiser 2024. PUBLICATION, USE OR REPRODUCTION incl. parts ONLY WITH WRITTEN PERMISSION. |